MAHINDRA MANULIFE BALANCED ADVANTAGE FUND
An open ended dynamic asset allocation fund
 |
 |
 |
 |
 |
| Data as on 29th, February 2024 | ||||
| Investment Objective | The investment objective of the Scheme is to provide capital appreciation and generate income through a dynamic mix of equity, debt and money market instruments. The Scheme seeks to reduce the volatility by diversifying the assets across equity, debt and money market instruments. However, there can be no assurance that the investment objective of the Scheme will be achieved. |
| Fund Features |
Optimal asset allocation at regular intervals. Aims to capture the optimum mix between Equity and Debt across market cycles. With flexibility to invest upto 100% in equity & debt, the Scheme may be suitable for volatile market conditions. Endeavours to provide tax efficiency* *Though the scheme is a dynamic asset allocation scheme, the endeavour will be to invest a minimum of 65% of its net assets in equity and equity related instruments which may help in attracting equity taxation as per prevailing tax laws. |
| Fund Manager and Experience | Fund Manager (Equity): Mr. Manish Lodha Total Experience: 23 years Experience in managing this fund: 2 Years and 2 months (Managing since December 30, 2021) Fund Manager (Equity): Ms. Fatema Pacha Total Experience: 18 years Experience in managing this fund: 2 Years and 2 months (managing since December 30, 2021) Fund Manager (Debt): Mr. Rahul Pal Total Experience: 22 years Experience in managing this fund: 2 Years and 2 months (Managing since December 30, 2021) |
| Date of allotment | December 30, 2021 |
| Benchmark | Nifty 50 Hybrid Composite Debt 50: 50 Index TRI |
| Options | Option: IDCW and Growth (D) D - Default |
| IDCW Sub-options: | IDCW Reinvestment (D) & IDCW Payout |
| Minimum Application Amount | Rs. 1,000/- and in multiples of Re.1/- thereafter |
| Minimum Redemption/Switch-Out Amount: | Rs. 1,000/- or 100 units or account balance, whichever is lower |
| SIP | Minimum Weekly & Monthly SIP Amount: Rs 500 and in multiples of Re 1 thereafter Minimum Weekly & Monthly SIP Installments: 6 |
| Monthly AAUM as on February 29, 2024 (Rs. in Cr.): | 691.83 |
| Monthly AUM as on February 29, 2024 (Rs. in Cr.): | 695.47 |
| Total Expense Ratio1 as on February 29, 2024: | Regular Plan: 2.32% Direct Plan: 0.61% 1Includes additional expenses charged in terms of Regulation 52(6A)(b) and 52(6A)(c) of SEBI (Mutual Funds) Regulations, 1996 and Goods and Services Tax. |
| Load Structure: | Entry Load: N.A. Exit Load: 10% of the units allotted shall be redeemed without any exit load, on or before completion of 3 months from the date of allotment of Units. Any redemption in excess of the above limit shall be subject to the following exit load: -An Exit Load of 1% is payable if Units are redeemed / switched-out on or before completion of 3 months from the date of allotment of Units; - Nil - If Units are redeemed / switched-out after completion of 3 months from the date of allotment of Units. |
| Annualised Portfolio YTM*2^: | 7.31%3 |
| Macaulay Duration^: | 2.25 years3 |
| Modified Duration^: | 2.17 |
| Residual Maturity^: | 2.86 years3 |
| Portfolio Turnover Ratio (Last 1 year): | 2.80 |
| As on (Date) | February 29, 2024 |
| ^For debt component *In case of semi annual YTM, it will be annualised 2Yield to maturity should not be construed as minimum return offered by the scheme; 3Calculated on amount invested in debt securities (including accrued interest), deployment of funds in TREPS and Reverse Repo and net receivable / payable. |
|
| NAV/Unit | Regular Plan (In Rs.) |
Direct Plan (In Rs.) |
| IDCW | 12.9563 |
13.4856 |
| Growth | 12.9563 |
13.4856 |
| IDCW: Income Distribution cum Capital Withdrawal | ||
Company / Issuer |
Rating |
% of Net Assets$ | % to NAV Derivatives |
|
|---|---|---|---|---|
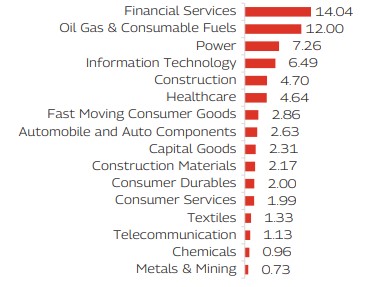
| Automobile and Auto Components | 2.63% |
|||
| Tata Motors Limited | 1.73% |
|||
| LG Balakrishnan & Bros Limited | 0.90% |
|||
| Capital Goods | 2.31% |
|||
| Inox India Limited | 1.06% |
|||
| Titagarh Rail Systems Limited | 0.63% |
|||
| Apar Industries Limited | 0.33% |
|||
| Jyoti CNC Automation Ltd | 0.28% |
|||
| Chemicals | 0.96% |
|||
| Gujarat State Fertilizers & Chemicals Limited | 0.51% |
|||
| Atul Limited | 0.45% |
|||
| Construction | 4.70% |
|||
 |
Larsen & Toubro Limited | 2.75% |
||
| IRCON International Limited | 0.99% |
|||
| Power Mech Projects Limited | 0.96% |
|||
| Construction Materials | 2.17% |
|||
| ACC Limited | 1.46% |
|||
| Orient Cement Limited | 0.72% |
|||
| Consumer Durables | 2.00% |
|||
| Voltas Limited | 0.80% |
|||
| Dixon Technologies (India) Limited | 0.77% |
|||
| Titan Company Limited | 0.44% |
|||
| Consumer Services | 1.99% |
|||
| EIH Limited | 1.13% |
|||
| Aditya Vision Ltd | 0.86% |
|||
| Fast Moving Consumer Goods | 2.86% |
|||
| United Spirits Limited | 1.26% |
|||
| Britannia Industries Limited | 1.07% |
|||
| Balrampur Chini Mills Limited | 0.54% |
|||
| Financial Services | 14.04% |
-2.05% |
||
|
Canara Bank | 3.45% |
||
| State Bank of India | 1.72% |
|||
| ICICI Bank Limited | 1.13% |
-1.14% |
||
| Union Bank of India | 1.05% |
|||
| Shriram Finance Limited | 0.95% |
|||
| The Jammu & Kashmir Bank Limited | 0.91% |
|||
| RBL Bank Limited | 0.90% |
-0.90% |
||
| HDFC Asset Management Company Limited | 0.86% |
|||
| CreditAccess Grameen Limited | 0.85% |
|||
| Cholamandalam Investment and Finance Company Ltd | 0.78% |
|||
| The South Indian Bank Limited | 0.75% |
|||
| Punjab National Bank | 0.70% |
|||
| Healthcare | 4.64% |
|||
| Cipla Limited | 1.60% |
|||
| Dr. Reddy's Laboratories Limited | 1.48% |
|||
| Biocon Limited | 0.99% |
|||
| Piramal Pharma Limited | 0.57% |
|||
| Divi's Laboratories Limited | 0.01% |
|||
| Information Technology | 6.49% |
-0.94% |
||
|
Tata Consultancy Services Limited | 2.96% |
||
| Wipro Limited | 1.64% |
|||
| LTIMindtree Limited | 0.95% |
|||
| MphasiS Limited | 0.94% |
-0.94% |
||
| Metals & Mining | 0.73% |
-0.73% |
||
| NMDC Limited | 0.73% |
-0.73% |
||
| Oil Gas & Consumable Fuels | 12.00% |
-1.87% |
||
|
Coal India Limited | 4.36% |
-1.46% |
|
|
Reliance Industries Limited | 3.11% |
||
|
Hindustan Petroleum Corporation Limited | 2.45% |
||
| Indian Oil Corporation Limited | 1.67% |
|||
| GAIL (India) Limited | 0.41% |
-0.41% |
||
| Power | 7.26% |
-3.55% |
||
|
NTPC Limited | 4.03% |
-2.19% |
|
| Tata Power Company Limited | 1.87% |
|||
| Power Grid Corporation of India Limited | 1.36% |
-1.37% |
||
| Telecommunication | 1.13% |
|||
| Bharti Airtel Limited | 1.13% |
|||
| Textiles | 1.33% |
|||
| K.P.R. Mill Limited | 0.77% |
|||
| Vardhman Textiles Limited | 0.55% |
|||
| Equity and Equity Related Total | 67.25% |
-9.14% |
||
| Certificate of Deposit | 5.16% |
|||
|
Punjab National Bank | CRISIL A1+ |
3.39% |
|
| HDFC Bank Limited | CRISIL A1+ |
1.76% |
||
| Corporate Bond | 6.25% |
|||
|
National Bank For Agriculture and Rural Development | CRISIL AAA |
3.51% |
|
| Power Finance Corporation Limited | CRISIL AAA |
1.44% |
||
| Bharti Telecom Limited | CRISIL AA+ |
1.30% |
||
| Government Bond | 10.15% |
|||
|
7.18% GOI (MD 14/08/2033) | SOV |
4.85% |
|
| 7.38% GOI (MD 20/06/2027) | SOV |
2.18% |
||
| 7.37% GOI (MD 23/10/2028) | SOV |
2.11% |
||
| 7.18% GOI (MD 24/07/2037) | SOV |
1.01% |
||
| Treasury Bill | 4.57% |
|||
| 364 Days Tbill (MD 02/01/2025) | SOV |
1.76% |
||
| 364 Days Tbill (MD 07/03/2024) | SOV |
1.44% |
||
| 364 Days Tbill (MD 21/11/2024) | SOV |
1.37% |
||
| Cash & Other Receivables | 6.63% |
|||
| Grand Total | 100.00% |
|||
| $Hedged and Unhedged positions | ||||
| ( Top Ten Holdings - Issuer wise) as on February 29, 2024) |
||||
| Mahindra Manulife Balanced Advantage Fund | CAGR Returns (%)
|
Value of Investment of Rs. 10,000* |
NAV / Index Value (as on February 29, 2024) |
||
| Managed by Mr. Manish Lodha, Ms. Fatema Pacha & Mr. Rahul Pal | 1 Year |
Since Inception |
1 Year |
Since Inception |
|
| Regular Plan - Growth Option | 31.03 |
12.69 |
13,113 |
12,956 |
12.9563 |
| Direct Plan - Growth Option | 33.30 |
14.80 |
13,340 |
13,486 |
13.4856 |
| Nifty 50 Hybrid Composite Debt 50: 50 Index^ | 18.27 |
9.55 |
11,833 |
12,186 |
14,211.32 |
| Nifty 50 TRI^^ | 28.40 |
13.29 |
12,849 |
13,105 |
32,360.25 |
^Benchmark ^^Additional Benchmark. Inception/Allotment date: 30-Dec-21. CAGR - Compounded Annual Growth Rate. Past performance may or may not be sustained in future and should not be used as a basis of comparison with other investments. Since inception returns of the scheme is calculated on face value of Rs. 10 invested at inception. The performance details provided above are of Growth Option under Regular and Direct Plan. Different Plans i.e Regular Plan and Direct Plan under the scheme has different expense structure. *Based on standard investment of Rs. 10,000 made at the beginning of the relevant period. For performance details of other schemes managed by the Fund Manager(s), please click here | Best Viewed in Landscape mode
| Mahindra Manulife Balanced Advantage Fund |
Regular Plan |
Direct Plan |
NIFTY 50 Hybrid Composite Debt 50:50 Index^ |
Nifty 50 Index TRI^^ |
|||||
| SIP Investment Period | Total Amount Invested (  ) ) |
Market Value ( ) |
CAGR Returns (%) |
Market Value ( ) |
CAGR Returns (%) |
Market Value ( ) |
CAGR Returns (%) |
Market Value ( ) |
CAGR Returns (%) |
| 1 Year | 120,000 |
141,123 |
34.32 |
142,476 |
36.62 |
131,481 |
18.28 |
137,805 |
28.73 |
| Since Inception | 270,000 |
335,841 |
20.00 |
343,122 |
22.10 |
311,978 |
12.98 |
331,209 |
18.66 |
^Benchmark ^^Additional Benchmark. CAGR – Compounded Annual Growth Rate. Inception/Allotment date: 24-Aug-20. Past performance may or may not be sustained in future and should not be used as a basis of comparison with other investments. Returns greater than 1 year period are compounded annualized. For SIP returns, monthly investment of equal amounts invested on the 1st business day of every month has been considered. CAGR Returns (%) are computed after accounting for the cash flow by using the XIRR method (investment internal rate of return). For SIP Performance please click here | Best Viewed in Landscape mode
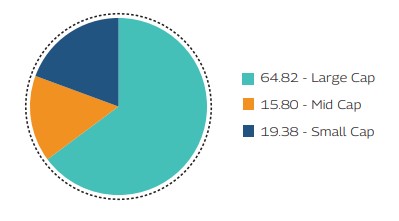
As per the latest Market Capitalisation data provided by AMFI (In line with the applicable SEBI guidelines)
Product Suitability |
|
| This Product is Suitable for investors who are seeking* | |
|
|
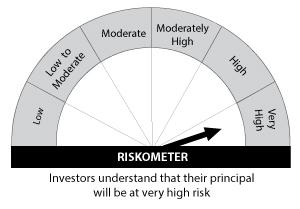
Scheme Riskometers |
Benchmark Riskometers |
 |
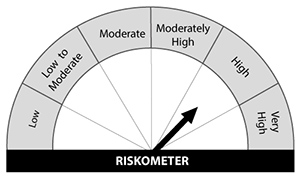 Scheme Benchmark: Nifty 50 Hybrid Composite Debt 50: 50 Index TRI |
* Investors should consult their financial advisers if in doubt about whether the product is suitable for them. |
|